
In recent months, a number of investment experts have opined that the U.S. yield curve will soon “invert” and that means a recession is right around the corner. That sounds scary. But what does it really mean?
Let’s begin by defining our terms. What exactly is a yield curve?
A yield curve is a line that plots the interest rates of bills, notes, and bonds having equal credit quality but differing maturity dates (such as 2-year, 5-year, 10-year, and 30-year debt). The shape of the yield curve is viewed as having predictive power regarding changes in economic output and growth 1. See below for a picture of a yield curve.
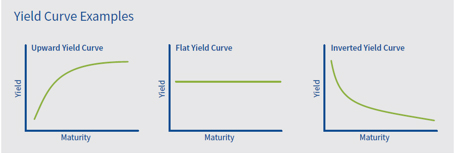
Generally speaking, an upward sweeping yield curve, in which short-term interest rates are lower than long-term rates, is indicative of an expanding economy. If short-term interest rates are low, companies and individuals are more likely to borrow money and buy things, thus driving economic growth.
A yield curve can also be flat. A flat yield curve means that short-term interest rates are similar to those of long-term rates. An “inverted” yield curve occurs when short-term interest rates are higher than long-term rates – and in some cases may predict an oncoming recession. The theory behind this is that when short-term interest rates are high, companies and individuals borrow and spend less, with the result being a slowing or even contracting economy.
Currently, the U.S. yield curve is flat and in jeopardy of inverting. As of October 16, the 2-year Treasury note is 2.86% and the 10 year Treasury is 3.16%. That means that the narrowing difference between short and long-rates is now only 0.30% (or 30 basis points). This is largely the result of the fact that the Federal Reserve has increased its short-term rate target three times this year (0.25% each time) such that it is now 2.00 – 2.25%. We fully expect that the Fed will raise this rate one more time this year (another 0.25%) to bring the target rate up to 2.25 – 2.50%. Next year, the Fed is expected to raise rates two to three times (most likely 0.25% each). It is not hard to imagine that the Fed’s overnight rate could be above 3% by the end of 2019!
Here are a couple of important points to remember:
- The U.S. yield curve has inverted prior to 5 of the last 5 recessions. That fact seems to give the yield curve great predictive abilities.
- The yield curve has not inverted just yet and it may not for some time. It is still flat and the spread between short and long rates is very small.
- Interest rates on long-term U.S. bonds have increased over the last couple of weeks. On September 1, the 10-year U.S. Treasury bond was 2.90. As of October 16, it is 3.16% for an increase of 0.26% (or 26 basis points). Obviously, the yield cannot invert if long-term interest rates are rising by the same amount – or by a greater amount – than short term interest rates.
- When a yield curve does eventually invert (short term rates exceed long term rates), a recession does not seem to occur immediately. Generally, the recession lags the yield curve inversion. Please see the chart below depicting the last 5 recessions.
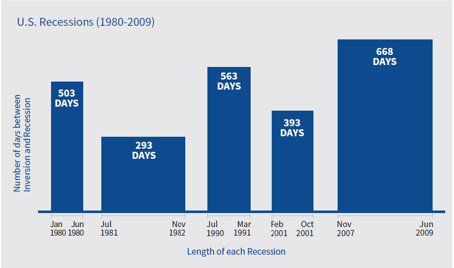
It’s worth noting that, in 4 of the 5 recessions, it was more than a year after the inversion of the yield curve before the recession began. So even if we acknowledge that an inverted yield curve has been a fairly reliable predictor of recessions, it’s hard to make the case in today’s flat-yield-curve environment that an economic recession is imminent. That sounds a little less scary, doesn’t it?
The information in this report was prepared by John Weitzer, Chief Investment Officer of First Command. Opinions represent First Command’s opinion as of the date of this report and are for general informational purposes only and are not intended to predict or guarantee the future performance of any individual security, market sector or the markets generally. First Command does not undertake to advise you of any change in its opinions or the information contained in this report. This report is not intended to be a client-specific suitability analysis or recommendation, an offer to participate in any investment, or a recommendation to buy, hold or sell securities. Do not use this report as the sole basis for investment decisions. Do not select an asset class or investment product based on performance alone. Consider all relevant information, including your existing portfolio, investment objectives, risk tolerance, liquidity needs and investment time horizon. Should you require investment advice, please consult with your financial advisor. Risk is inherent in the market. Past performance does not guarantee future results. Your investment may be worth more or less than its original cost. Your investment returns will be affected by investment expenses, fees, taxes and other costs.