
Are We Suffering from Wage Stagnation?
By: Bill Haynes, CFA, CPA
Investment Analyst
Oct 4, 2019 | 7 min. read
A rising tide lifts all boats. This optimistic phrase conveys that all should benefit when the economy is booming. But there is concern that not everyone has benefited from the current economic expansion, which is entering its record eleventh year. Despite the lowest unemployment rates in 50 years, some indicators suggest that we continue to be plagued by a stubborn and widespread stagnation in wages.
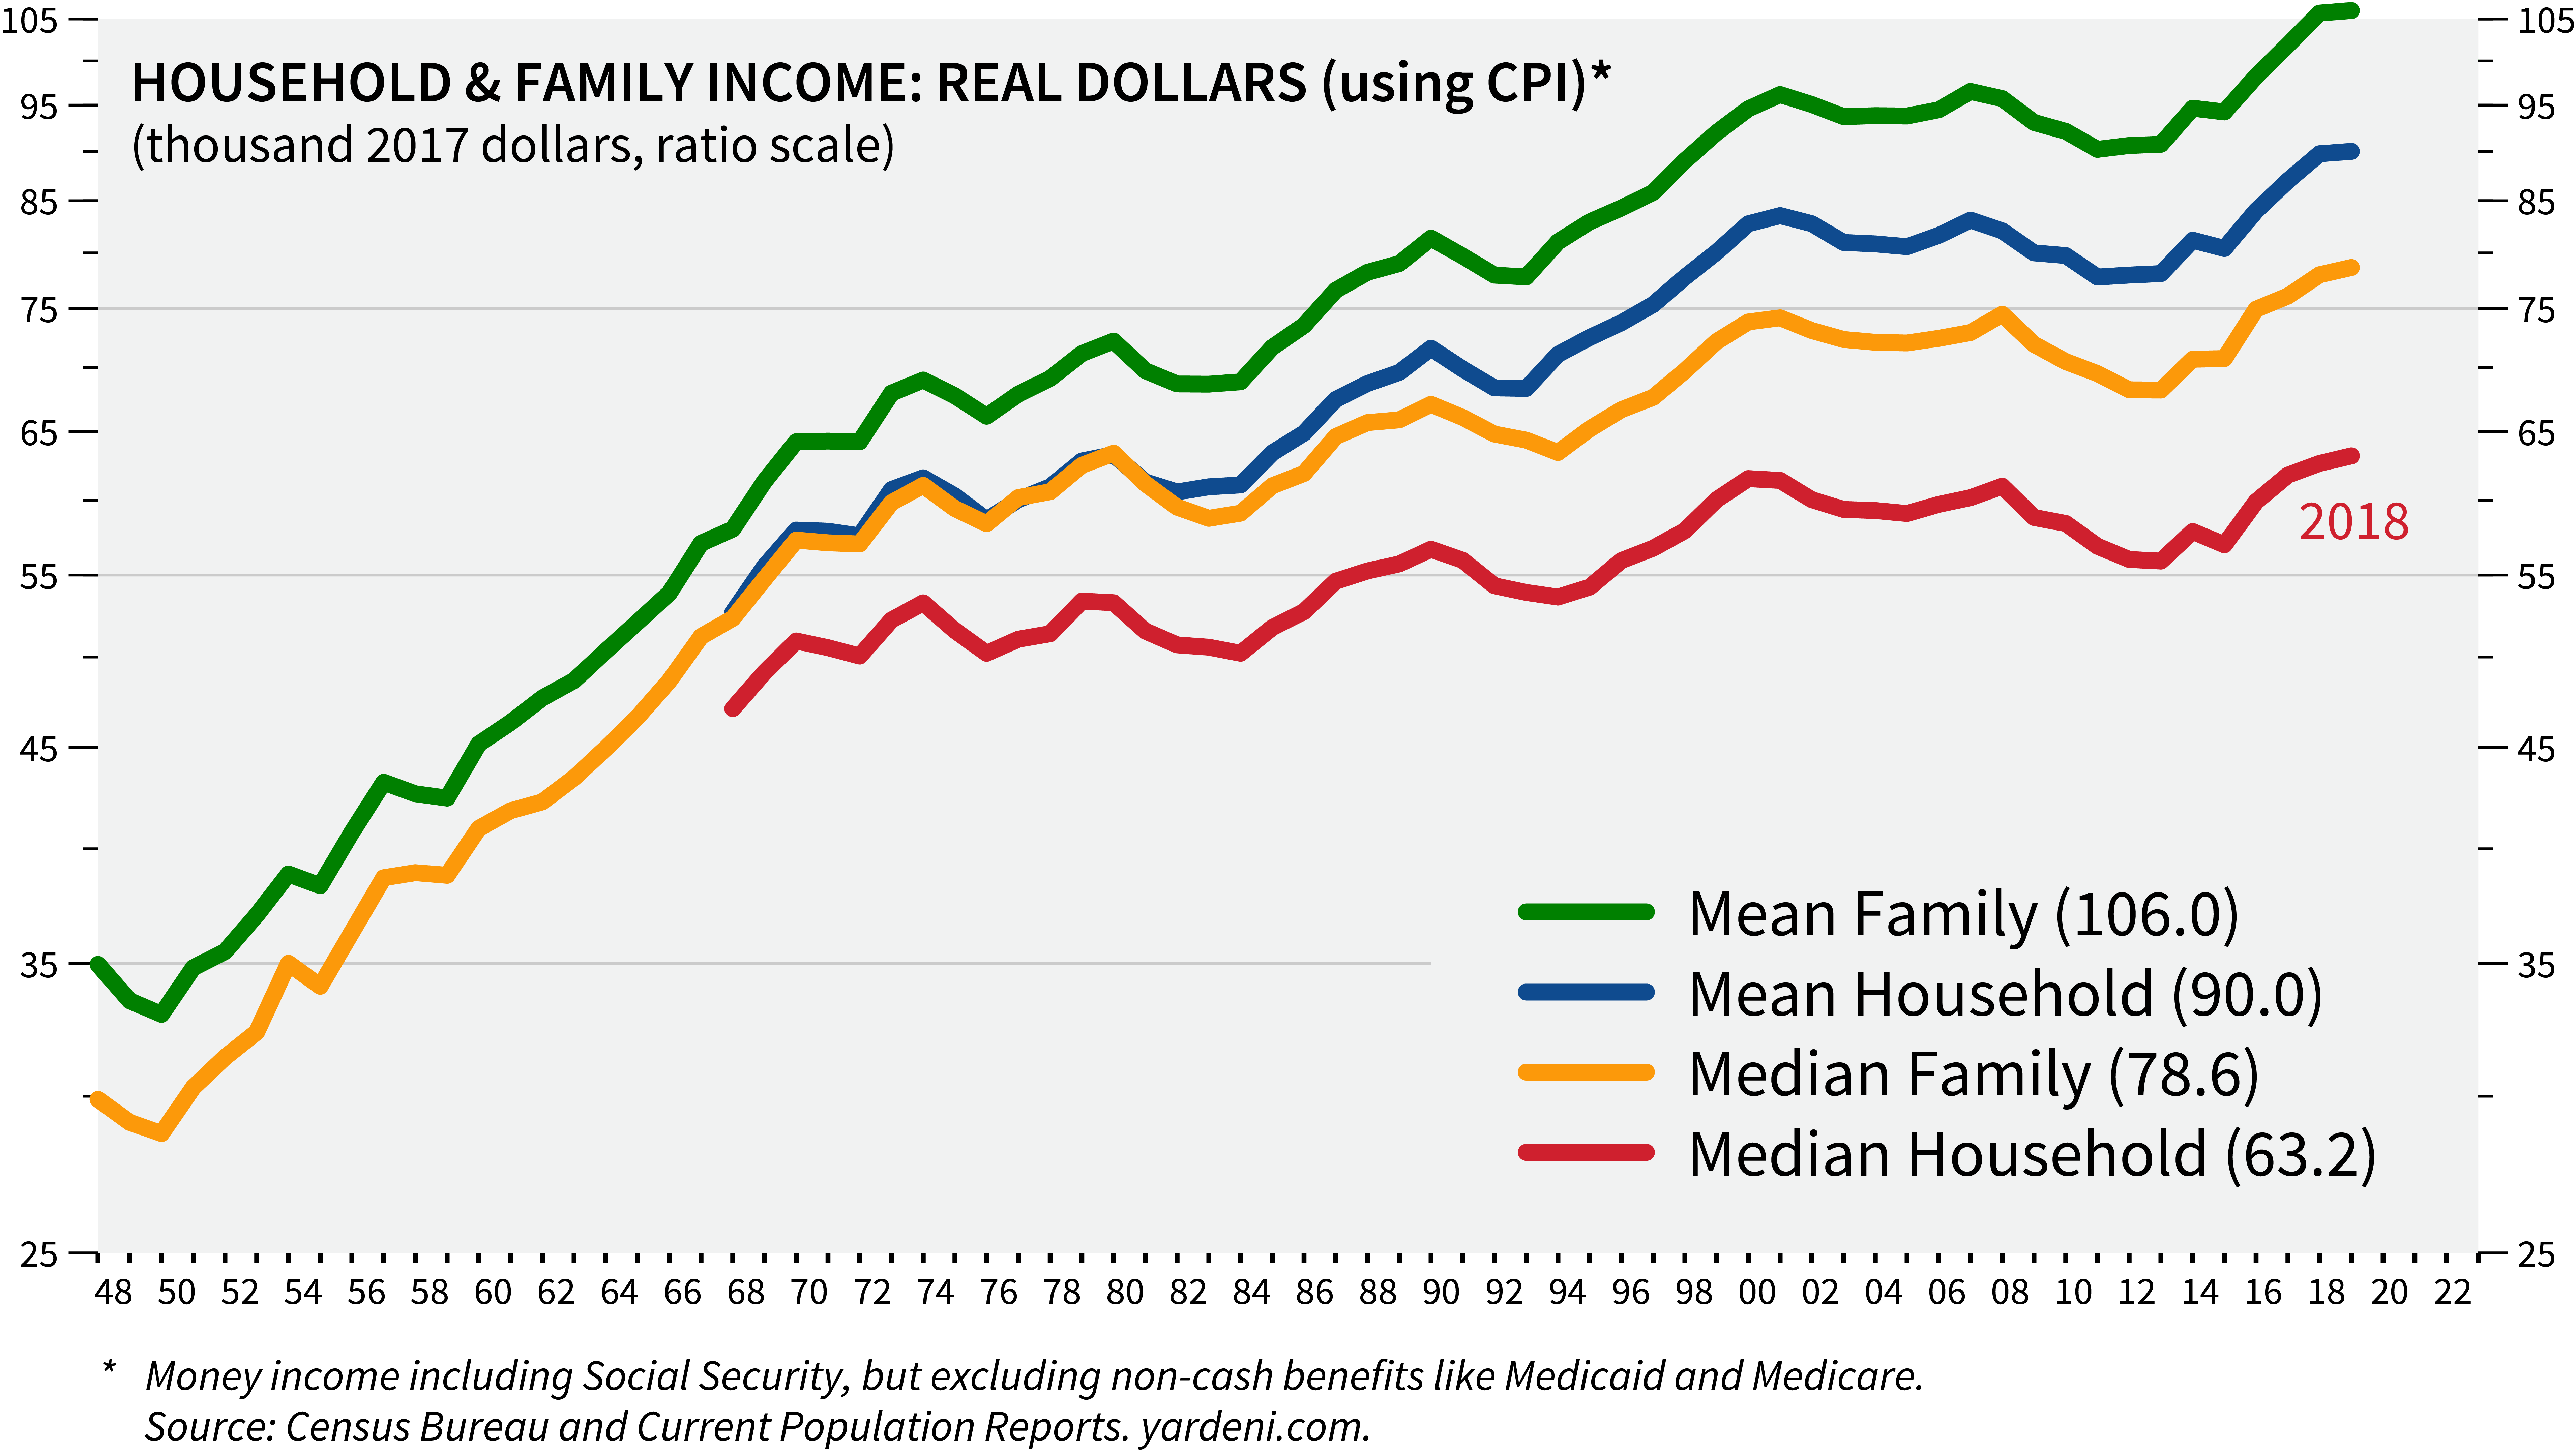
The chart below shows median and mean household and family income in real terms since 1948. Household income includes the income of all people 15 years and older living in a household. Median household income represents the income level earned by a given household where half of the households earn more, and half earn less. According to Yardeni Research, median household income increased a meager 7.4 percent in the 28 years between 1989 and 2017.
[1]
There are different ways to measure inflation.
When you hear economists or the media discuss growth rates, they are generally referring to “real rates.” Real rates are inflation-adjusted estimates that incorporate a deflator. For instance, if you receive a three percent pay raise and inflation is two percent, then your real income increased one percent. There are two formulas commonly used to identify inflationary trends: The Consumer Price Index (CPI) and the Personal Consumption Expenditures (PCE) Index.
The CPI is a widely recognized and often used measurement for identifying periods of inflation or deflation. The CPI measures the change in the weighted average price of a defined basket of consumer goods and services.
The PCE is a less-well-known deflator. The Federal Reserve Board, which establishes monetary policy, uses the PCE for evaluating the true pace of inflation. The PCE measures the price changes in goods and services that consumers actually purchase. By doing so, it reveals consumer shopping habits. Substantial price increases may cause consumers to buy less or shift to a similar, lower-cost product (think generic instead of brand name).
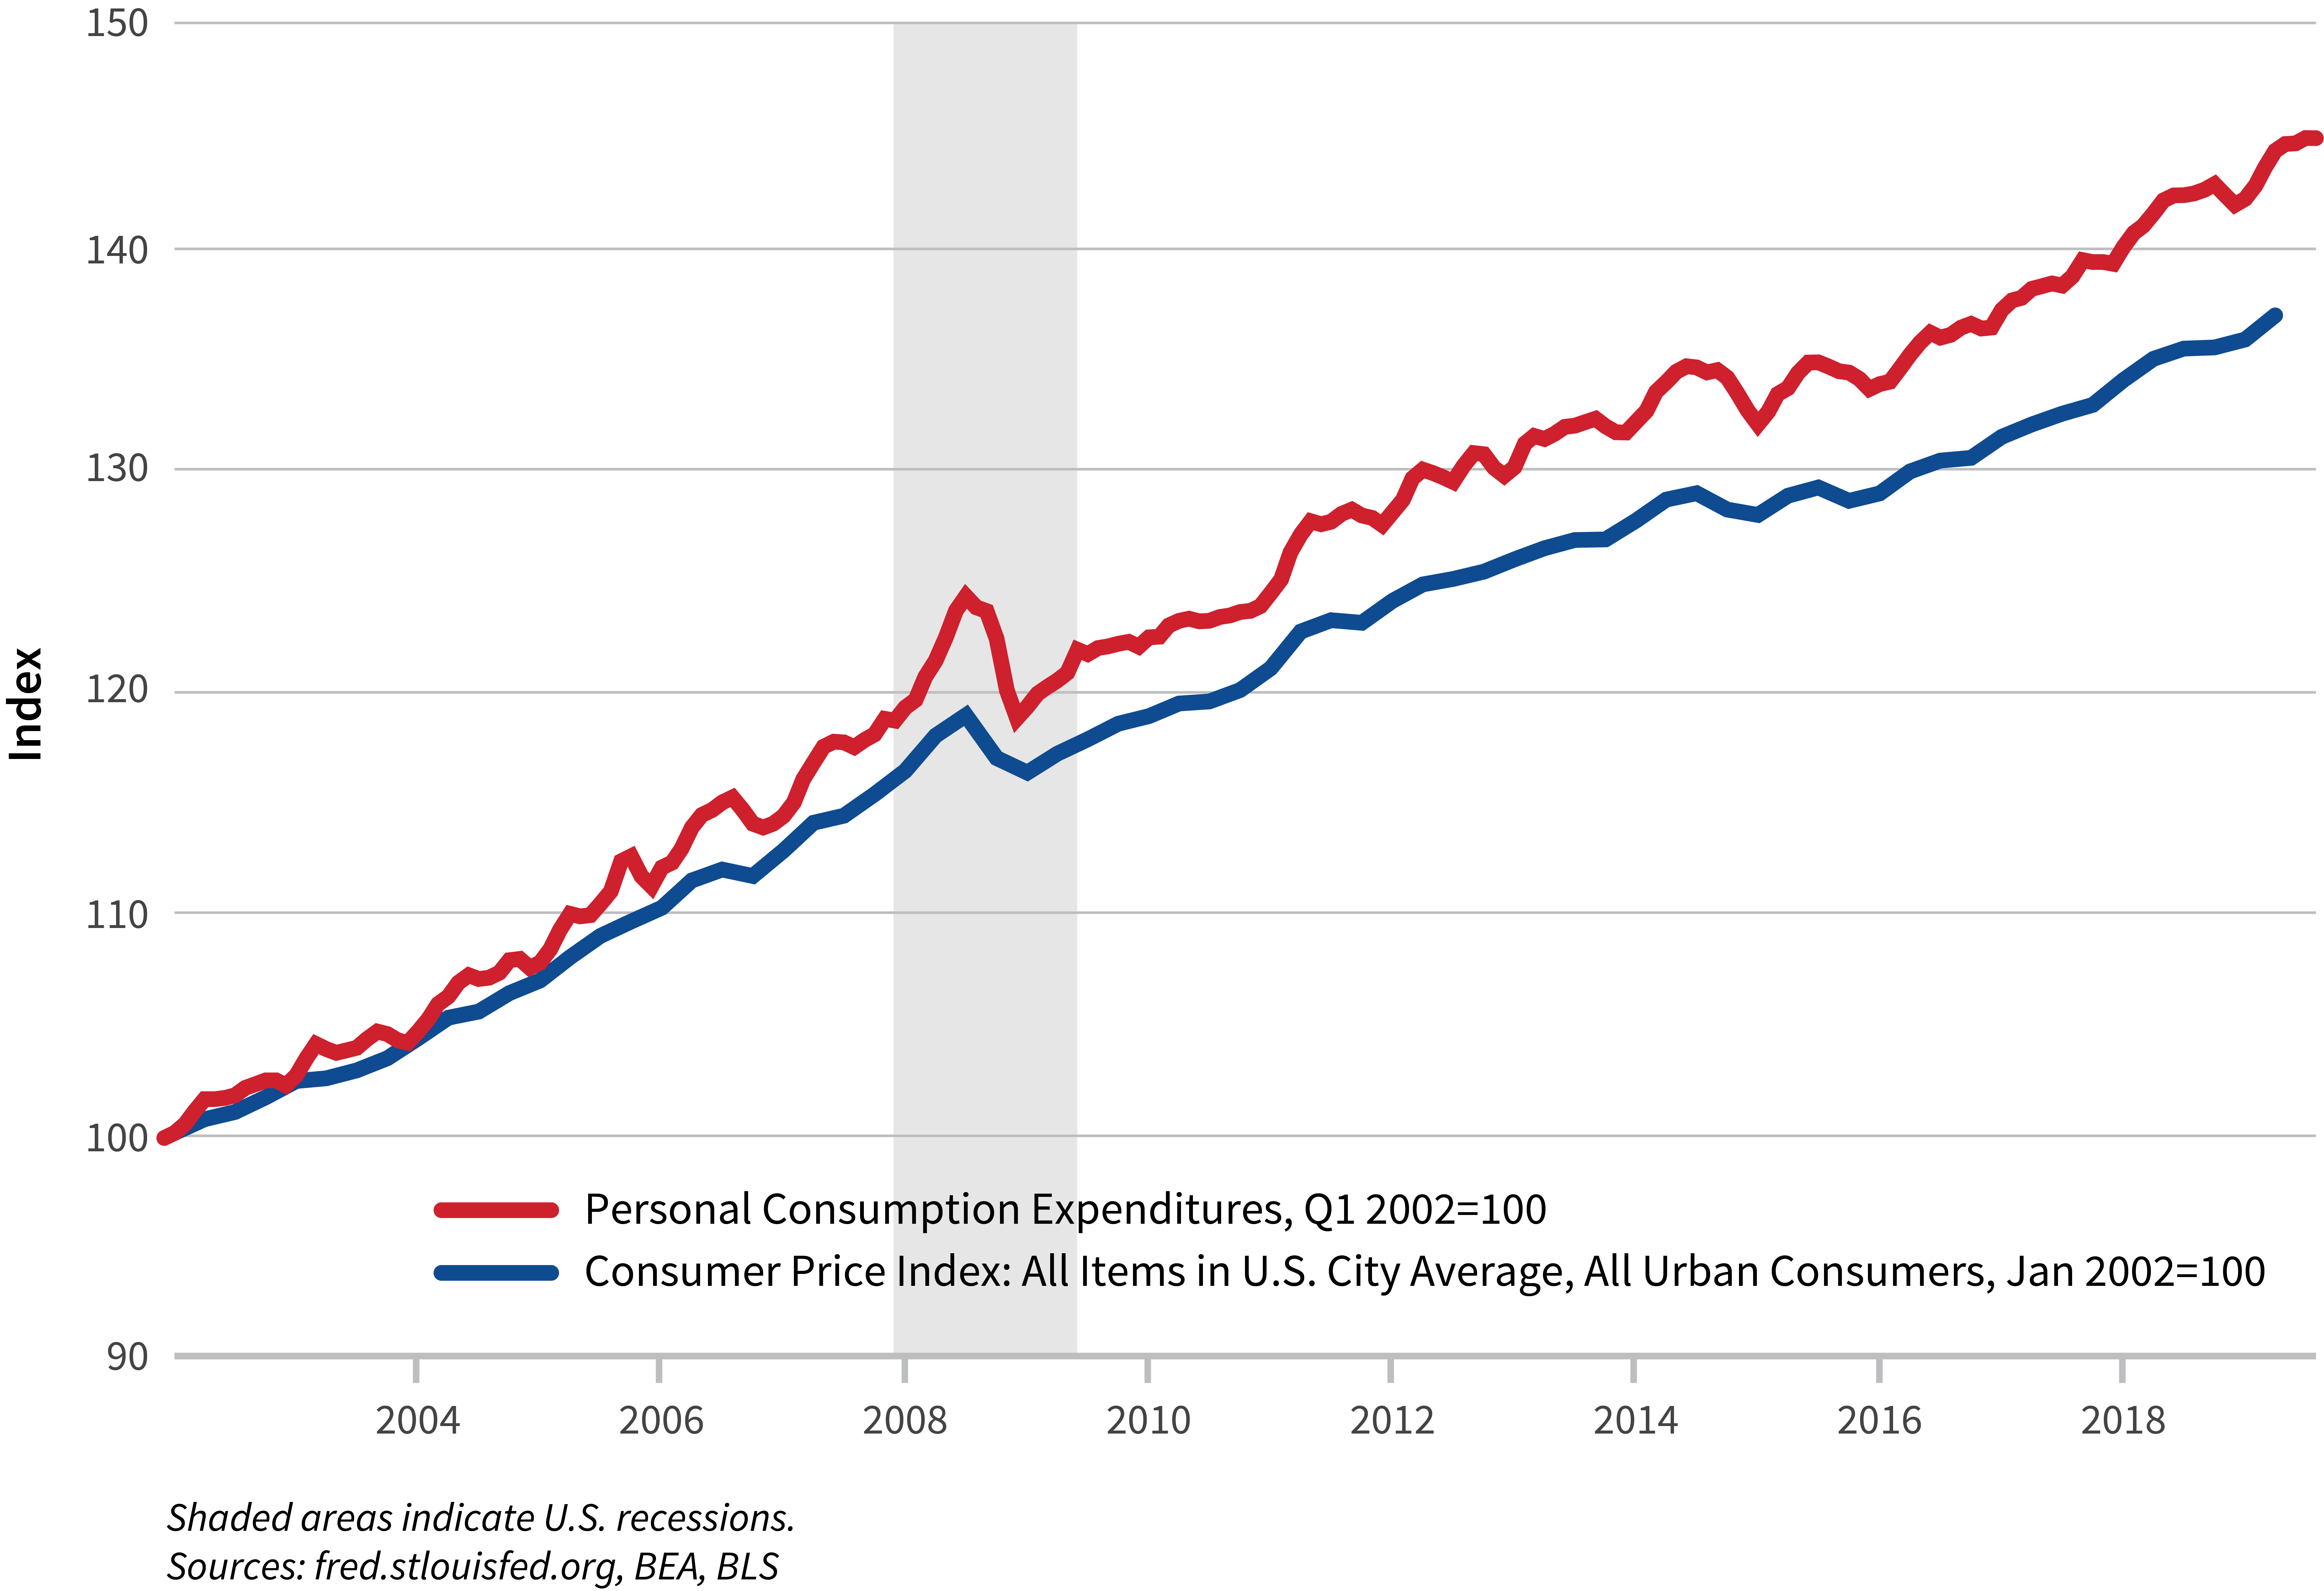
The chart below shows the CPI and PCE indices side-by-side. In 2006, the two indices started separating, with the CPI increasing at a higher rate and thus reporting higher inflation.
[2]
Household income will typically be deflated with the PCE.
In February 2000, the Federal Reserve Board of Governors [3] adopted PCE as their deflator and cited several advantages of the PCE compared to the CPI:
- The PCE formula reflects the changing composition of spending, which better aligns with consumer behavior.
- Its weights are based on a more comprehensive measure of expenditures.
- Historical data used in the PCE can be revised to account for new information and improved measurement techniques.
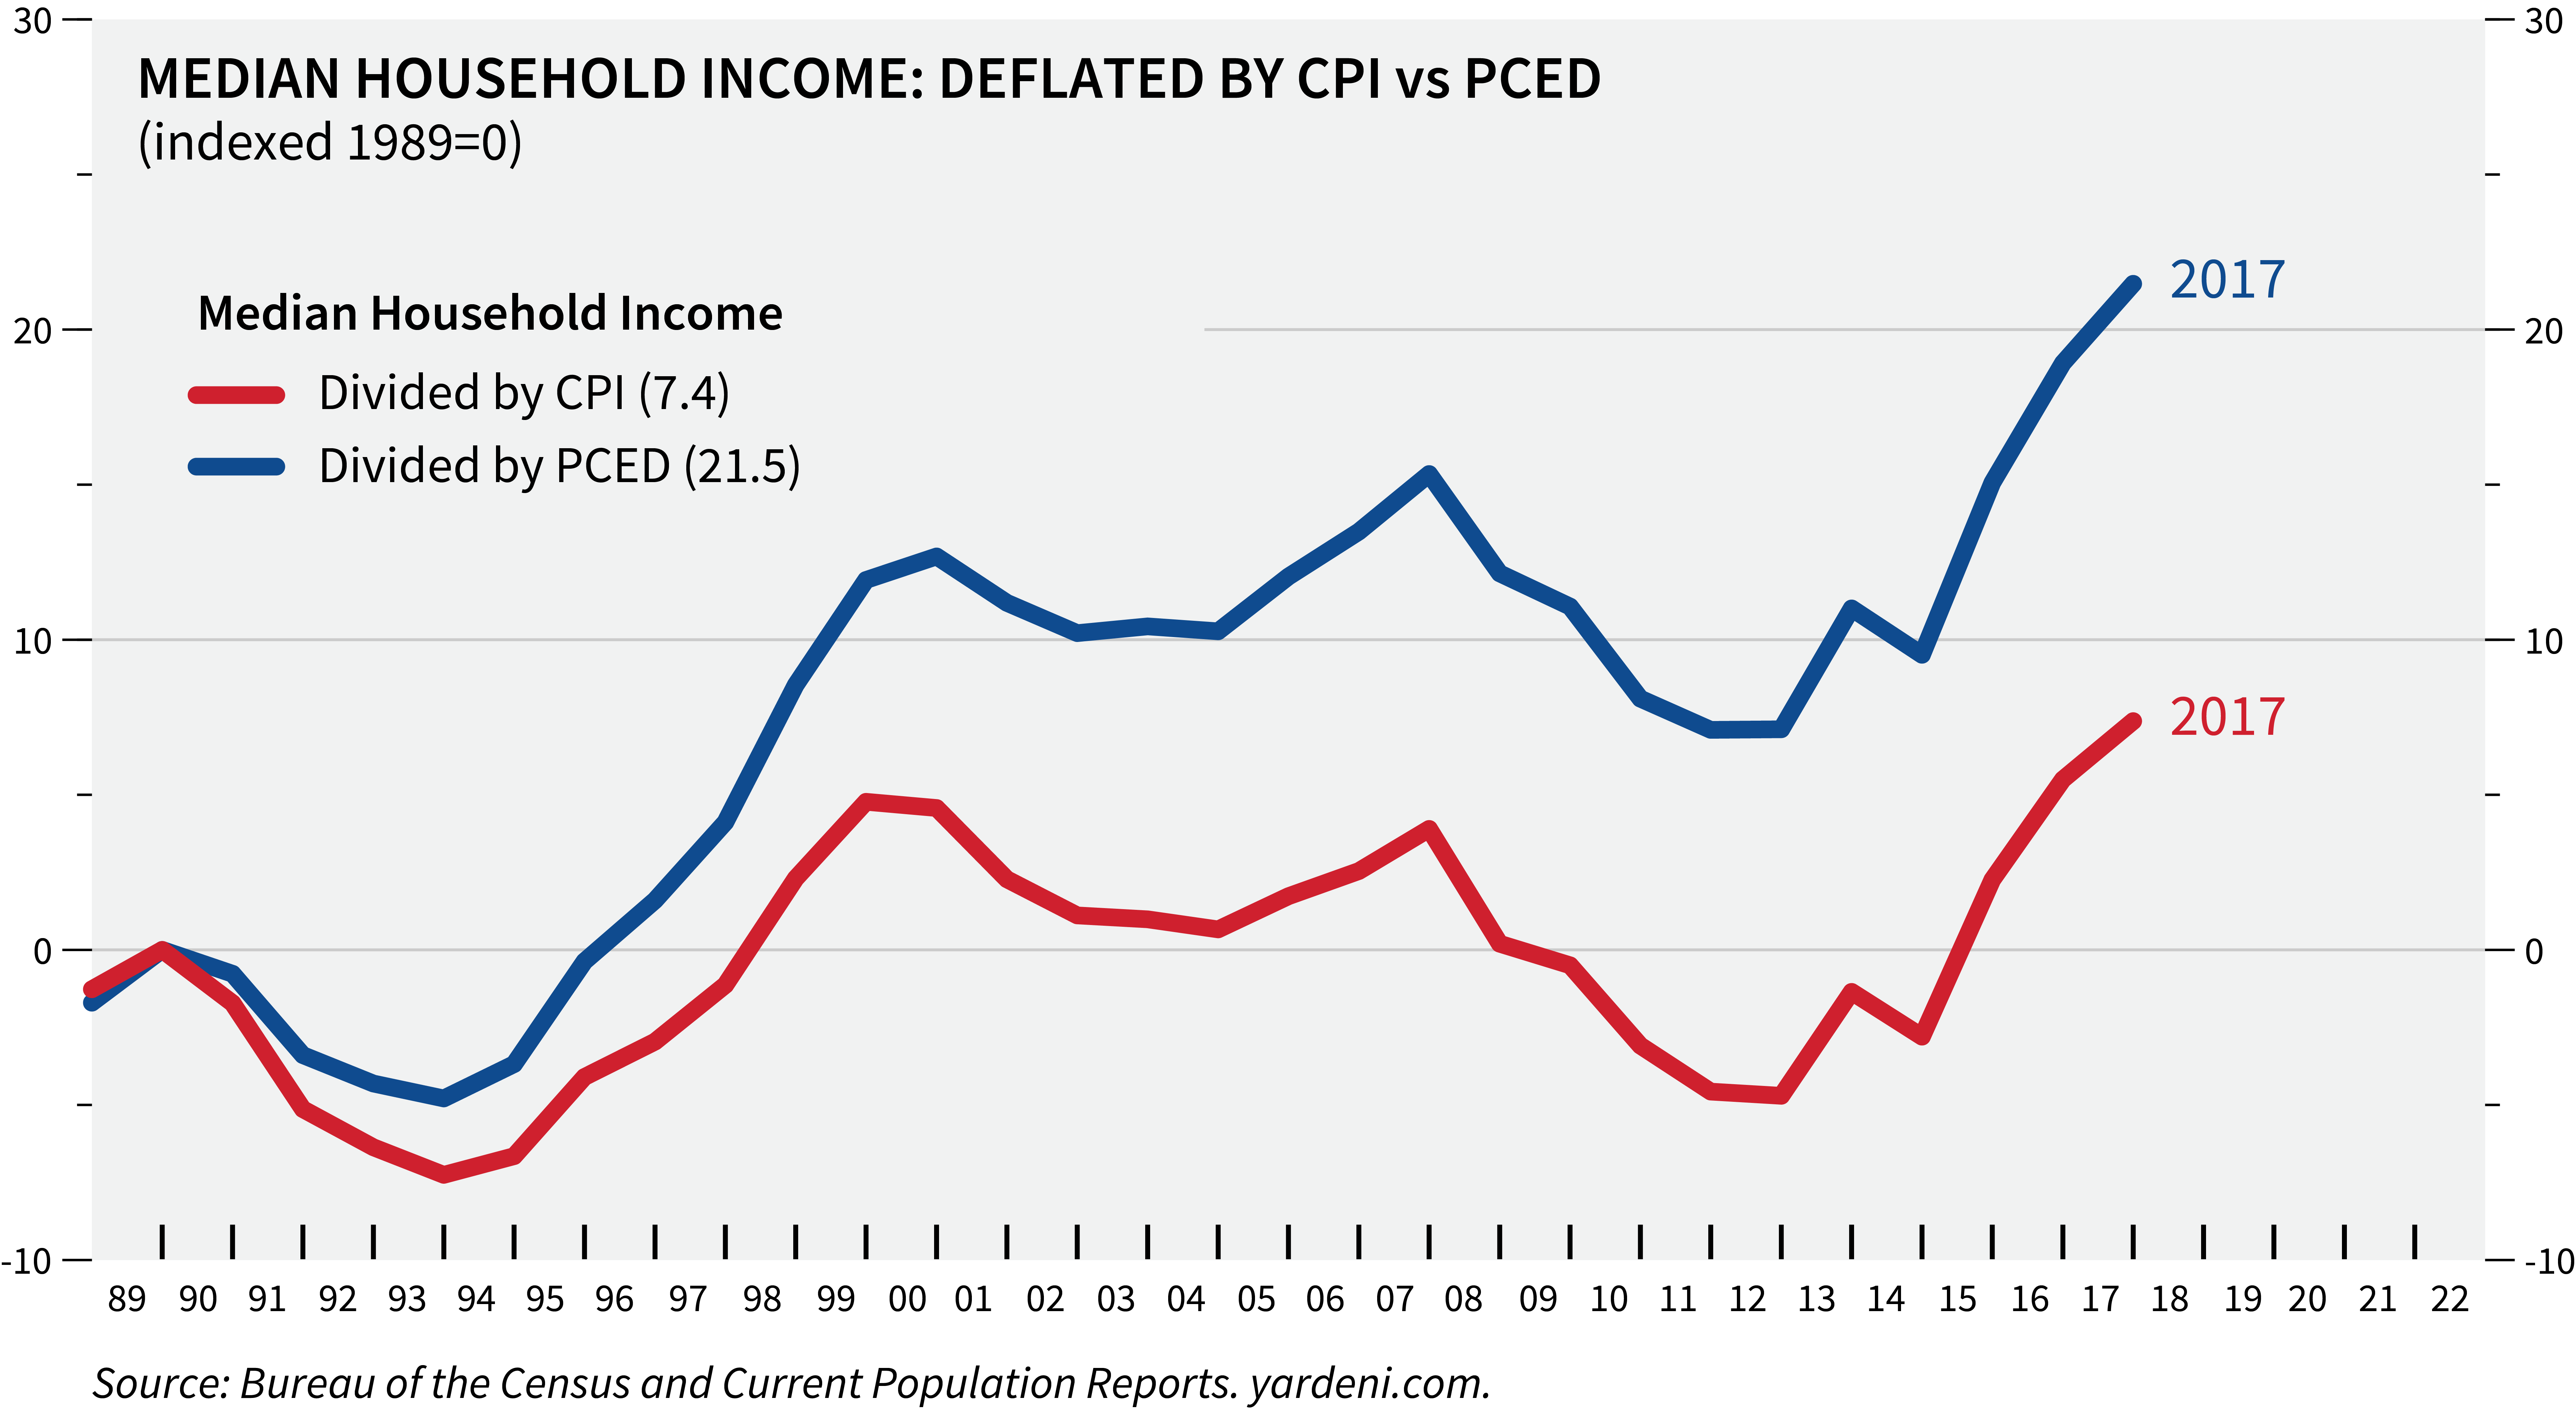
Since 2002, the CPI outpaced PCE by six percent (see chart above). This discrepancy makes a material difference in the household income real rate of growth. The chart below compares median household income using the CPI and PCE. When household Income is adjusted with the PCE instead of the CPI, real median household income shows a more robust 21.5 percent increase since 1989, weakening the wage stagnation argument. Not only does the growth in household income look better using PCE, it may be even greater than that for the following reasons.
[4]
- Fewer wage earners per household dulls growth.
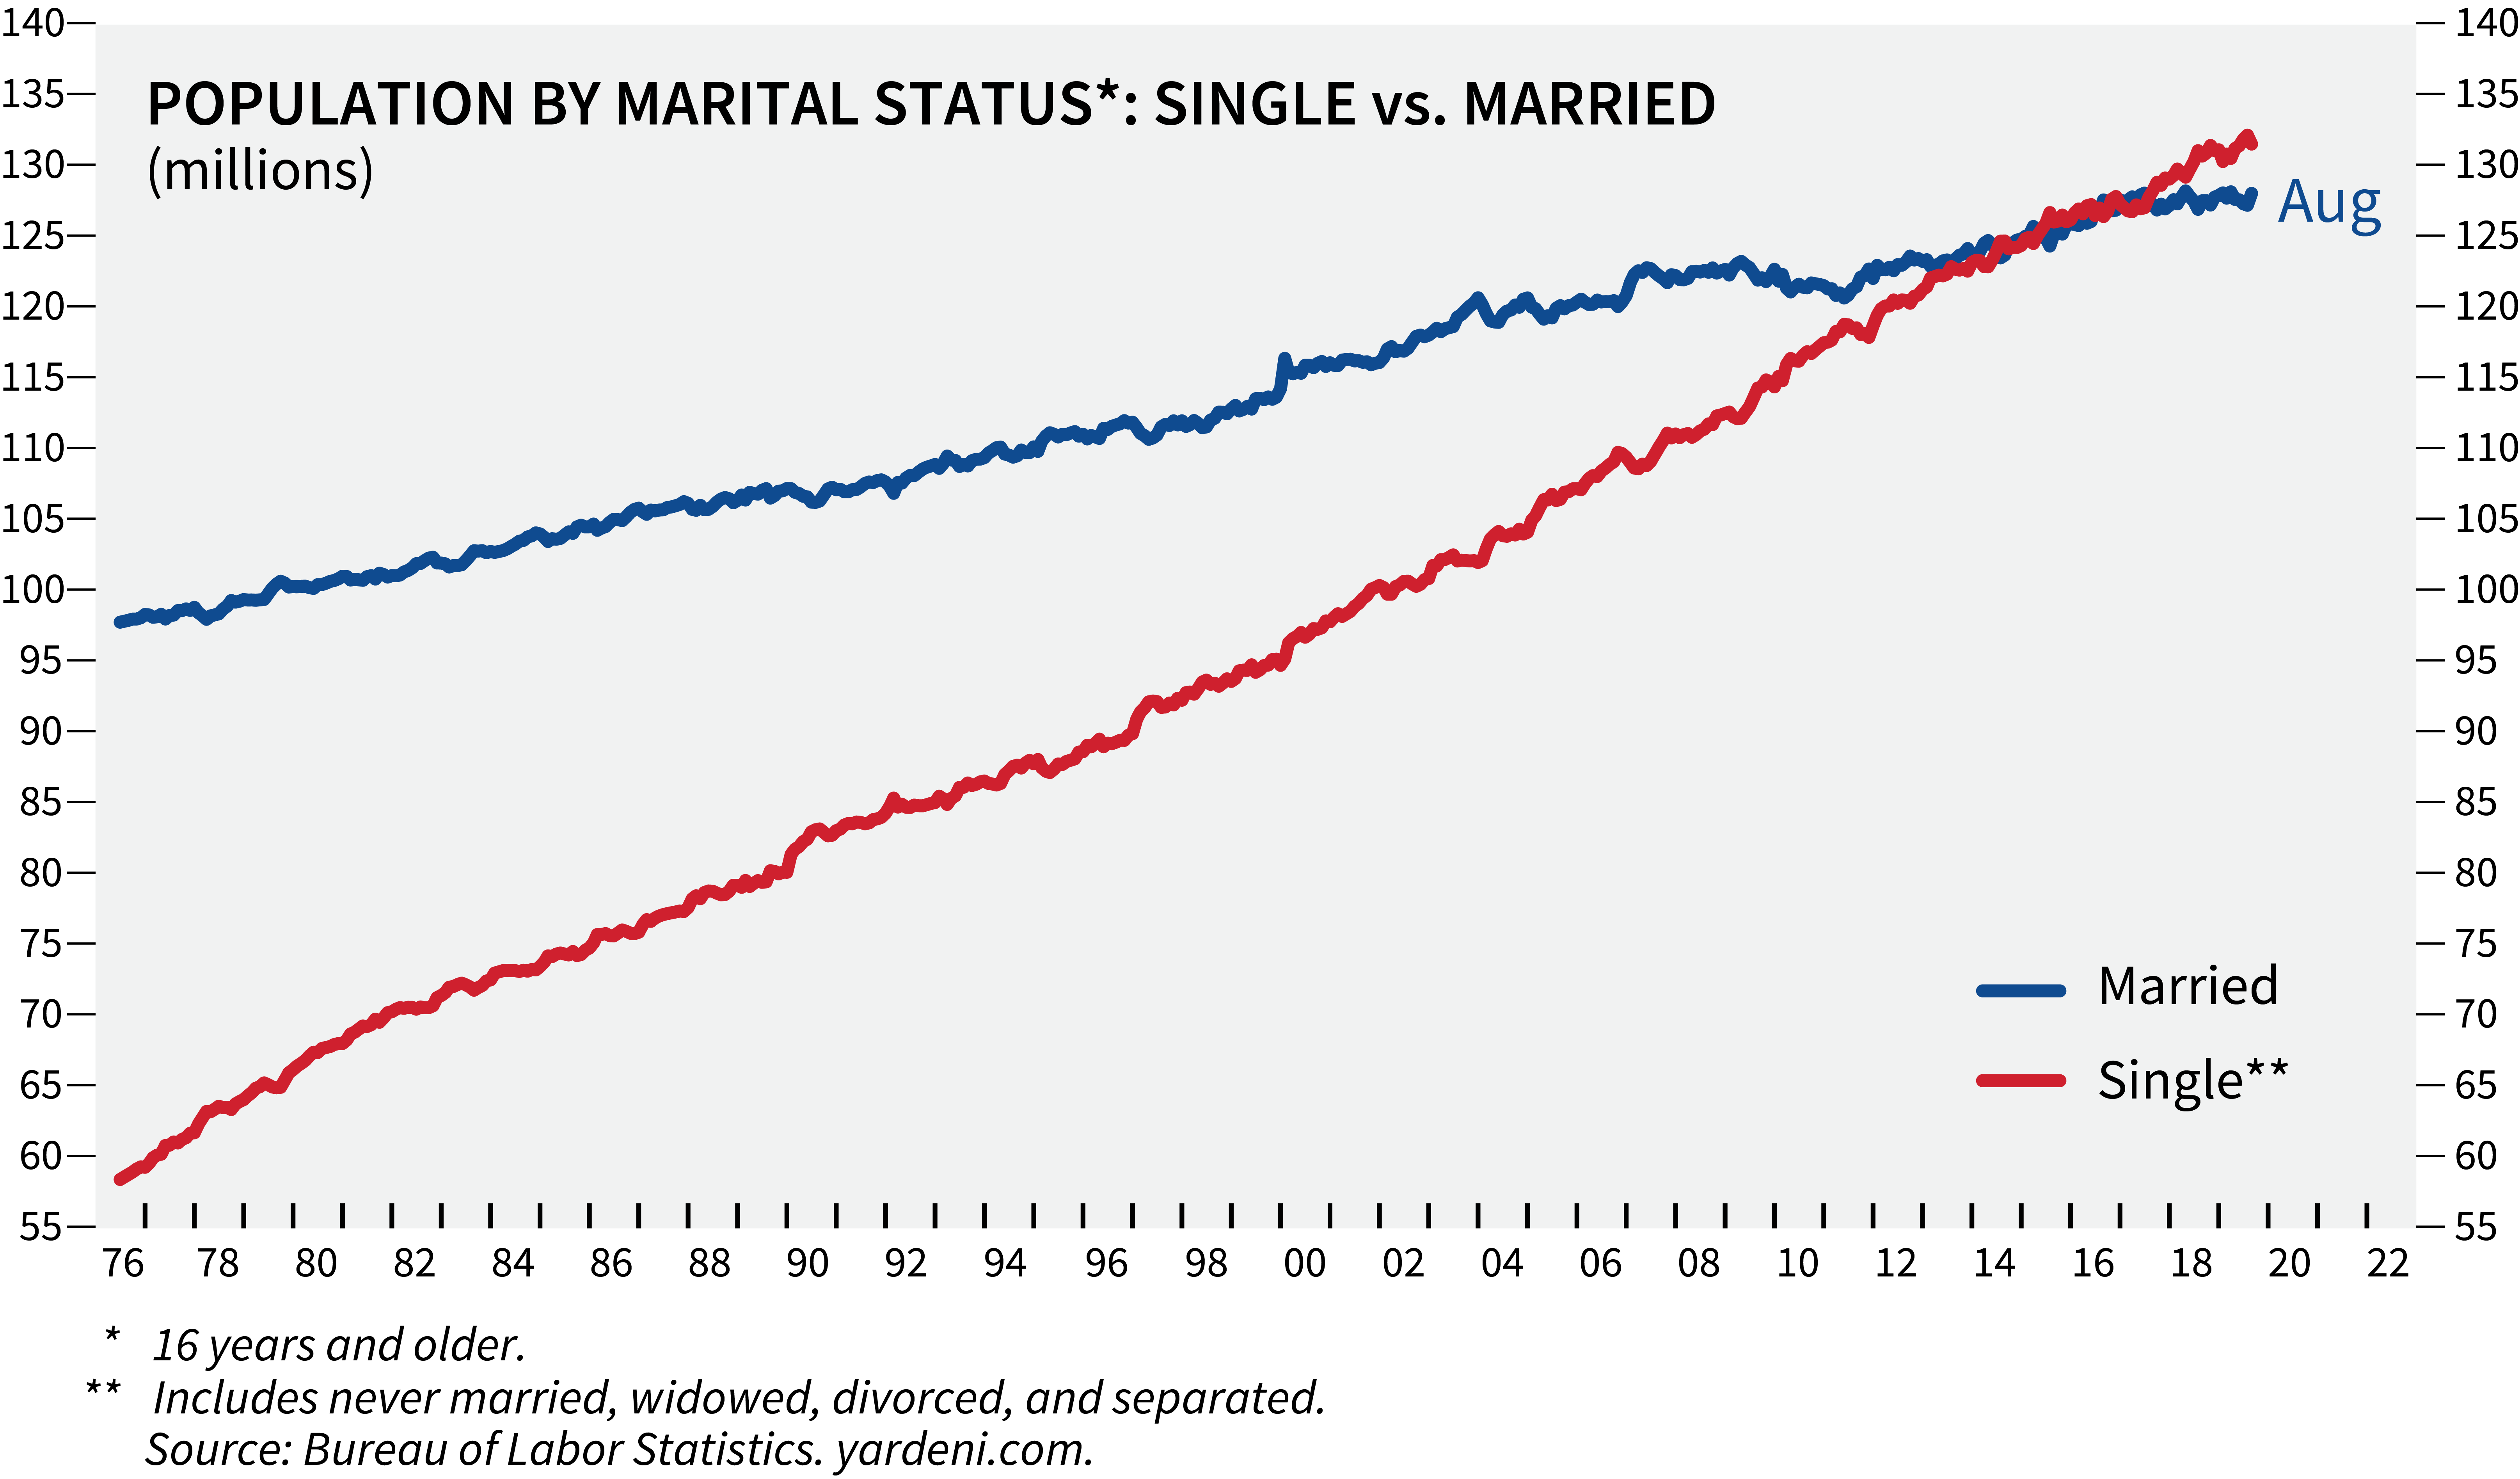
Many factors can influence household income, including age, industry, geography, household size, education, ethnicity and gender. Let’s focus on household size and age. On average, the more wage earners in a household, the higher the household income. Since the late 1970s, the growth rate of single people has outpaced the growth rate of married couples (see below chart). Today, single-person households outnumber married households. The rise in single households has very likely dampened household income growth.
[5]
2. Household income is depressed when younger workers replace retired workers.
Age also impacts household income. Younger workers have higher wage growth, and older workers earn more. The table below shows the median weekly earnings by age group as of December 2018. Weekly earnings include basic pay, incentive pay, and premium pay for overtime and late-shift work.
[6]
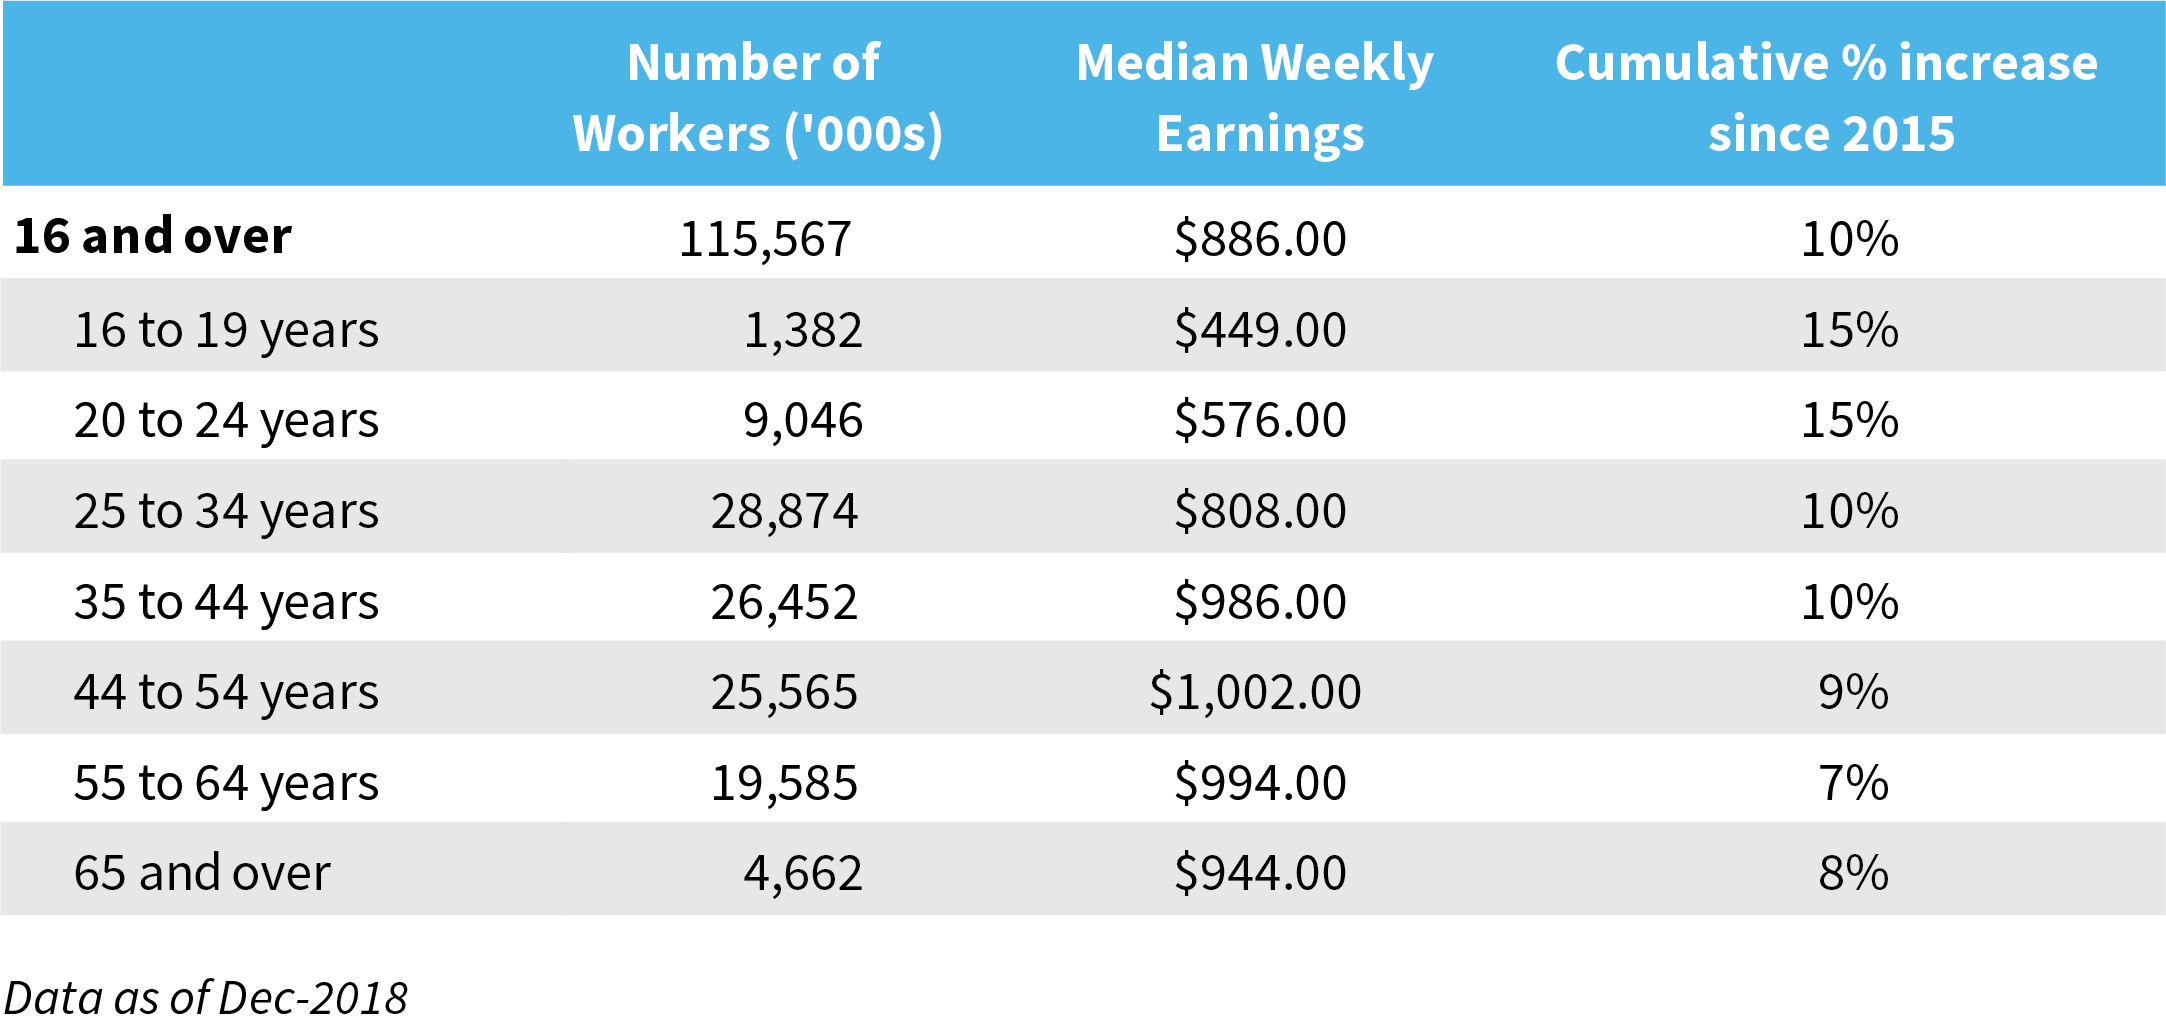
As young workers acquire new skills, hone their craft and get promotions, their wages increase faster than older workers. Since 2015, workers between 16 and 24 years old had the highest increase in weekly earnings at 15 percent. On the flip side, older workers between 55 and 65+ years old received only a 7 to 8 percent increase.
Additionally, median household income growth diminishes when an older worker retires. It takes multiple younger workers to replace an older worker’s income. A typical worker who is 65+ earns 65 percent more than the 20 to 24-year-old. For every two older workers who retire, it takes three younger workers to replace the lost income.
Summary
The following factors have led us to conclude that wages are less stagnant than widely believed:
- The Personal Consumption Expenditure (PCE) Index is a more accurate measure than the Consumer Price Index (CPI) for evaluating real growth rates.
- Household income appears low because there are more single-person households than in the past.
- The retirement of older workers depresses income growth.
[1] Yardeni Research, Inc. (2019)
[2] U.S. Bureau of Economic Analysis, Personal Consumption Expenditures [NC000349Q], retrieved from FRED, Federal Reserve Bank of St. Louis; https://fred.stlouisfed.org/series/NC000349Q, August 11, 2019.
[3] Monetary Policy Report to the Congress, February 17, 2000
[4] Yardeni Research, Inc. (2019)
[5] Yardeni Research, Inc. (2019)
[6] Bureau of Labor Statistics, Median usual weekly earnings of full-time wage and salary workers by age
Get Squared Away®
Let’s start with your financial plan.
Answer just a few simple questions and — If we determine that you can benefit from working with us — we’ll put you in touch with a First Command Advisor to create your personalized financial plan. There’s no obligation, and no cost for active duty military service members and their immediate families.