
Changing Tax Environments and the Long-Term Stock Investor
By: John S. Weitzer, CFA
Chief Investment Officer
Dec 18, 2020 | 4 min. read
As the incoming administration takes shape, should investors be wary of potential tax hikes?
Many investors are concerned that personal and corporate tax rates will rise over the next decade and that this will negatively affect U.S. stock markets. The rationale goes something like this:
- Work Less – Consumers will work less because their incentive to earn more will be diminished by higher taxes.
- Spend Less – Consumers will spend less because their after-tax income will be reduced.
- Profit Less – Companies’ profits will be under pressure due to higher corporate tax rates, and stock values will decline due to lower expected future profits.
At face value, these seem like logical conclusions. However, one thing I have learned over decades of studying the markets is that we should never underestimate the ability of U.S. companies to negotiate changing tax climates in order to achieve profits and drive stock market returns. U.S. companies can hire bright attorneys, tax accountants, and even well-connected lobbyists to help them negotiate different tax climates. Let’s look at history. In the chart below, we have tracked the following tax rates since 1913:
- Top marginal individual tax rate
- Long-term capital gains tax rate
- Dividend tax rate (at times, this has been the same as the top marginal individual tax rate)
- Top corporate tax rate
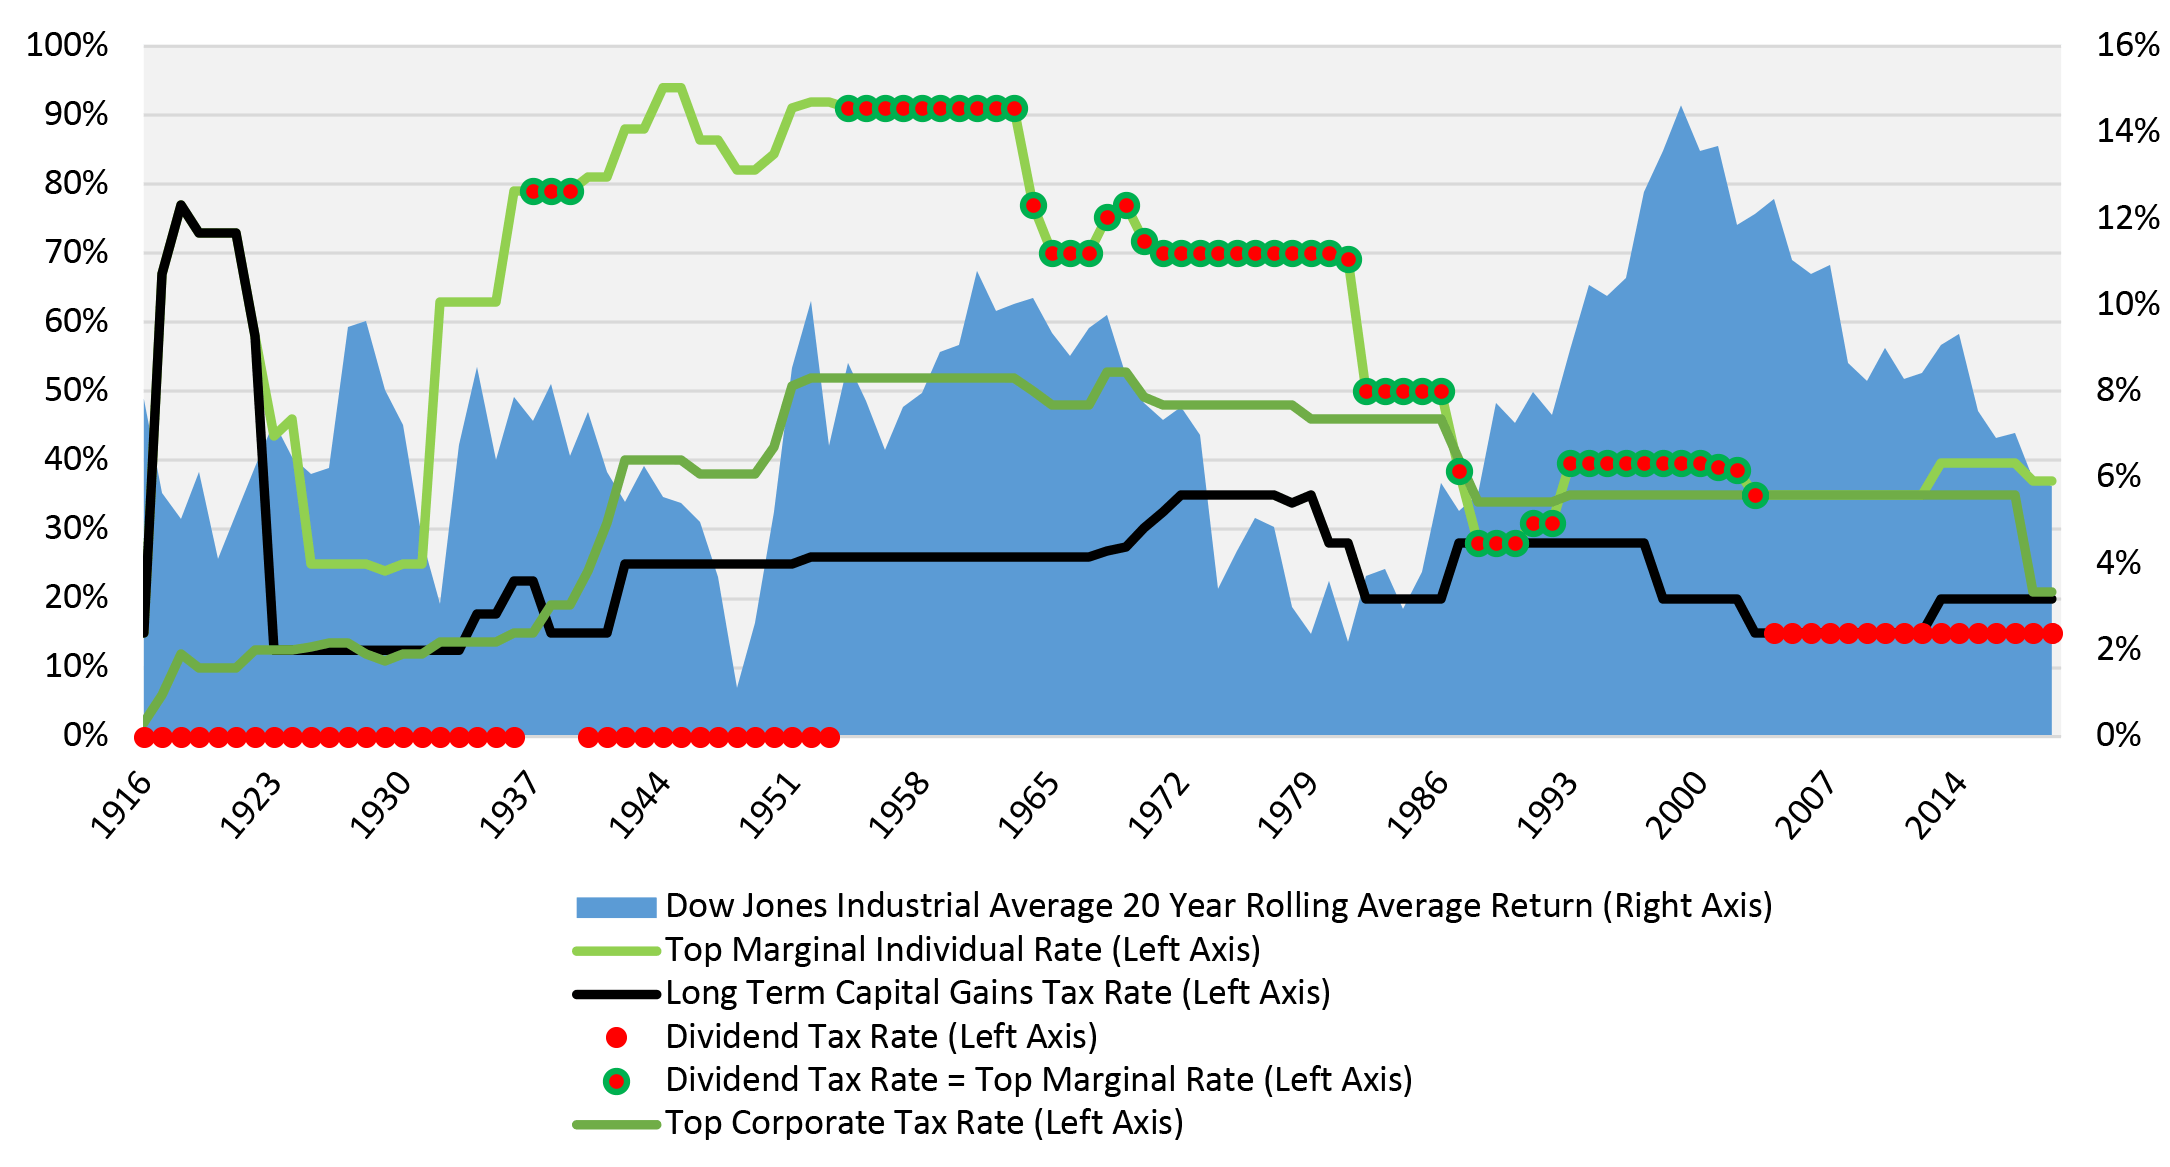
You can clearly see that these tax rates have changed over the last 100 plus years. Let’s observe them individually.
- Top marginal individual tax rate – This rate started out at seven percent in 1913 and ultimately peaked at 94 percent in 1944 and 1945. It then declined to 28 percent in 1988, and now stands at 37 percent.
- Long-term capital gains tax rate – This rate tracked the top marginal individual tax rate step by step until 1922 (58 percent) before lowering to 12.5 percent in 1923. It then stayed in the mid-teens until 1942 when it increased to 25 percent, before peaking at 35 percent in the 1970s, and then declining to around 20 percent today.
- Dividend tax rate – Interestingly enough, dividends were not taxed for the most part from 1913 through 1953, but then the rate tracked the top marginal tax rate until 2004 when it was reduced to 15 percent.
- Top corporate tax rate – This rate started at one percent in 1913, rose to the mid-teens during the 1920s and 1930s before soaring to 40 percent in 1942, and then increased even further to more than 50 percent in the 1950s and part of the 1960s. From there, it has trended lower, sitting today at 21 percent.
Clearly, U.S. tax policy has been all over the board since 1913 and yet long-term stock investors achieved consistently positive returns, as indicated by the solid blue line on the same chart which represents the average 20-year rolling average return for the Dow Jones Industrial Average (represented on the right axis). The average of those 20-year rolling average returns is 7.4 percent annually, with the lowest average return being 1.1 percent (this period included the Great Depression) and the highest being 14.6 percent (this period included the 1980s through the 1990s). The U.S. stock market, in other words, has been able to advance in multiple positive and negative tax environments.
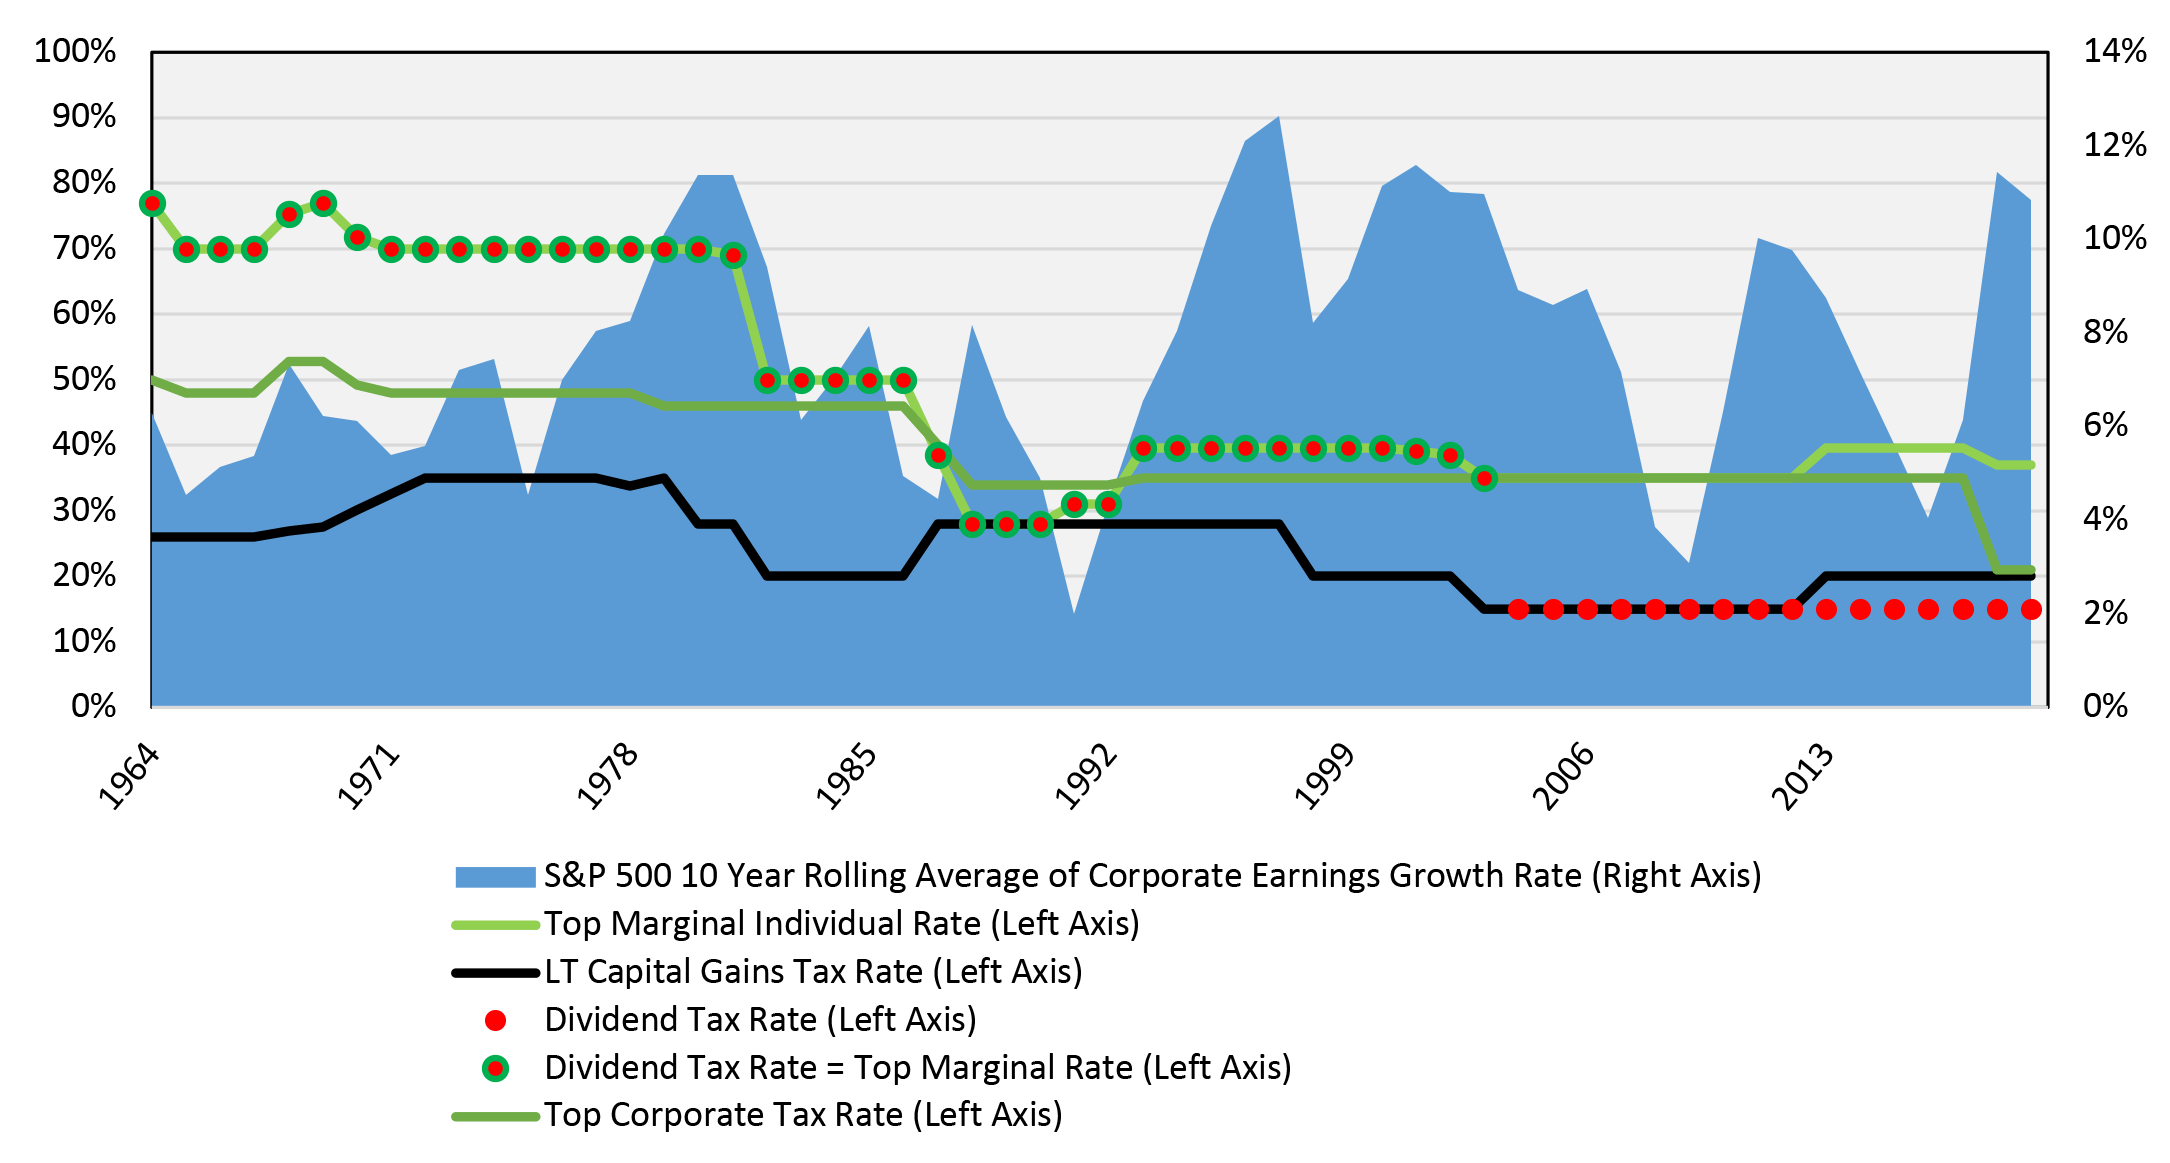
Now let’s look at the growth of corporate earnings, which began to be tracked in aggregate in 1954. The chart below is constructed in the same fashion as the preceding chart, but instead of showing stock market returns, it shows the 10-year rolling average of corporate earnings for companies in the S&P 500 Index. The average of those 10-year rolling average corporate earnings growth rates is 7.6 percent, with the lowest average earnings growth rate being two percent and the highest being 12.6 percent. U.S. companies, in other words, have been able to grow their earnings in multiple positive and negative tax environments.
What is the bottom line? As investors, we need to stay focused on disciplined long-term investing (which does not include trying to time the market or speculate about future tax rates) to pursue our financial goals. And we should not underestimate the ability of corporate America to succeed in changing tax climates.
First Command is here for you.
If you have questions or concerns specific to your situation that have not been addressed, please reach out to your Advisor. Thank you for the confidence you have placed in First Command. We are committed to being at our best for you at this important time.
The information in this report was prepared by John Weitzer, Chief Investment Officer of First Command. Opinions represent First Command’s opinion as of the date of this report and are for general informational purposes only and are not intended to predict or guarantee the future performance of any individual security, market sector or the markets generally. First Command does not undertake to advise you of any change in its opinions or the information contained in this report. This report is not intended to be a client-specific suitability analysis or recommendation, an offer to participate in any investment, or a recommendation to buy, hold or sell securities. Do not use this report as the sole basis for investment decisions. Do not select an asset class or investment product based on performance alone. Consider all relevant information, including your existing portfolio, investment objectives, risk tolerance, liquidity needs and investment time horizon. Should you require investment advice, please consult with your financial advisor. Risk is inherent in the market. Past performance does not guarantee future results. Your investment may be worth more or less than its original cost. Your investment returns will be affected by investment expenses, fees, taxes and other costs.
All estimates provided are for informational purposes only and should not be relied on to make investment or other decisions. Should you require investment advice, please consult with your financial advisor. Risk is inherent in the market. Past performance does not guarantee future results. Your investment may be worth more or less than its original cost. Your investment returns will be affected by investment expenses, fees, taxes and other costs.
The S&P 500 Index is widely regarded as the best single gauge of the U.S. equities market. This world-renowned index includes a representative sample of 500 leading companies in leading industries of the U.S. economy. Although the S&P 500 Index focuses on the large-cap segment of the market, with approximately 75% coverage of U.S. equities, it is also an ideal proxy for the total market. An investor cannot invest directly in an index.
The Dow Jones Industrial Average (DJIA) Index is a widely used gauge of the U.S. equities market with the longest history. The DJIA is a price-weighted stock market index that measures the stock performance of 30 large companies listed on stock exchanges in the United States. An investor cannot invest directly in an index.
©2020 First Command Financial Services, Inc. is the parent company of First Command Brokerage Services, Inc. (Member SIPC, FINRA), First Command Advisory Services, Inc., First Command Insurance Services, Inc. and First Command Bank. Securities products and brokerage services are provided by First Command Brokerage Services, Inc., a broker-dealer. Financial planning and investment advisory services are provided by First Command Advisory Services, Inc., an investment adviser. Insurance products and services are provided by First Command Insurance Services, Inc. Banking products and services are provided by First Command Bank (Member FDIC). Securities are not FDIC insured, have no bank guarantee and may lose value. A financial plan, by itself, cannot assure that retirement or other financial goals will be met.
Sources:
Information on tax rates was obtained from the following: Dividend Tax Rates (https://www.dividend.com/taxes/a-brief-history-of-dividend-tax-rates/), Capital Gains Rates (https://taxna.wolterskluwer.com/whole-ball-of-tax-2019/historical-capital-gain), Top Marginal Individual Rates (https://www.taxpolicycenter.org/statistics/historical-highest-marginal-income-tax-rates), Top Marginal Corporate Rates (https://www.taxpolicycenter.org/statistics/corporate-top-tax-rate-and-bracket).
Get Squared Away®
Let’s start with your financial plan.
Answer just a few simple questions and — If we determine that you can benefit from working with us — we’ll put you in touch with a First Command Advisor to create your personalized financial plan. There’s no obligation, and no cost for active duty military service members and their immediate families.